
Data Analysis of the Olympics from 1960 – 2016
I have loved exploring data, discovering the stories that data can tell and sharing the insights with business owners in order for them to make the most informed decisions.
As my past experience is working with website clients, I naturally started my data analysis journey by assessing website statistics data, specifically learning Google Analytics and Google Tag Manager.
From September to December 2020 I took the opportunity to further my data analytics skills and participated in the Data Analytics course at BrainStation. My final project submission was a joint effort with another course colleague. We focused on findings regarding host countries as well as athletes. I passed the certificate course in December 2020.
As this was a course project, I have included credits below for the software, datasets, images, etc., which were used throughout this project process.
Team
On this final project I worked with Alyson Nichol, a fellow course colleague.
My Role
Data Analyst
Timeline
The project took 2 months to complete. The course syllabus was designed in such a way that students would work on their projects over the duration of the course starting in October. Each week a new skill/concept was taught and the week that followed it would be put into practice on the final project.
Final project presentation and submission was December 2, 2020.
Hypothesis
The purpose of our analysis was to answer some, if not all, of the following questions:
- Is there a correlation between being a host country and increasing a country’s medal count?
- How many athletes participate per country and what is the correlation to increased medal count.
- Is the medal count per country closely correlated to GDP and/or Population?
- How many athletes participate in both summer and winter games and are there any trends around the sports that they participate in? Are there any stand-outs?
We hypothesized the following:
- We expected that host countries generally have more participants, therefore increasing the likelihood of making it to the podium.
- We expected that a larger number of participants, on average, does lead to more medals.
- We expected that countries with a higher GDP are more likely to get to the podium due to more funding available for training.
- We expected that there are a number of athletes that participate in both games and that there is a strong correlation between cycling and speed skating for sure (e.g. Clara Hughes, Canada).
Based on the theme of the above questions and hypotheses, the overriding main question that our analysis was looking to answer was:
What are some of the major factors contributing to a country’s success at the Olympics?
Project Tasks and Divisions
To ensure that both Alyson and I practiced all the skills being taught in the course we split the workload.
I was responsible for:
- Sourcing appropriate Olympic data
- Data review, clean up and formatting so it was usable
- Cross reference NOC (National Olympic Committee) codes with country codes
- Discuss dataset challenges and conflicts with teammate, review and research the situations, apply critical thinking and and make appropriate decisions as needed
- Data analysis for questions 2 and 4 of our hypothesis (as seen above)
Below you will find a summary of skills used and data visualizations for questions 2 and 4.
Datasets
There were a number of datasets needed in order to pull together all of the information required to answer the questions above.
- Olympic athlete dataset
Contained athlete and event-level data for every Olympic event - NOC (National Olympic Committee) regions dataset
Provided the actual region name associated with the NOC Region code which was included on the athlete dataset - GDP data by country dataset
Showed Income Category, by year starting from 1960 - World cities dataset (Zip file from Simplemaps.com)
Provided the corresponding country to major world cities to allow us to pull in the country for the Olympic host cities - Country codes dataset
Provided the ISO code by country, which was used to cross-reference to the NOC regions. The data was copied directly from the webpage and into a blank Excel file.
Question 2 Data Queries
Question: How many athletes participate per country and what is the correlation to increased medal count?
We hypothesized that countries with larger Olympic teams would increase their chances of earning medals.
Early on in our analysis we determined that rather than count the number of athletes who participated per country, we needed to look at athletes as event entrants. The reason for this is we needed to count the times in which an athlete could medal. For instance, one athlete could compete in a variety of events in speed skating as such it was critical to count event entrants to ensure our numbers were reflective of the situation.
As well for this question, the answers were based on NOC teams, rather than country. In the timeframe of 1960 to 2016, there were a few countries that were under different governmental rule with more intense athlete training programs and it was important to review the effectiveness of the NOC teams on their individual merit. Examples of this include the Soviet Union and Eastern Germany.
In order to answer this question, we needed to determine the following:
- the total number of entrants per country and NOC inclusive from 1960 to 2016
- the total number of medals won per country and NOC inclusive from 1960 to 2016
This answer and analysis were done using MySQL Workbench, Excel and Tableau.
- In MySQL Workbench an Olympics schema was created and the Table Data Import Wizard used the .csv file to setup the table and columns. When those were in place the data in the table was deleted.
- The Load Data Infile process was used to import the olympic_athlete_events_1960_to_present.txt file data into MySQL Workbench was process would take seconds to import, versus 10+ days if the Table Data Import Wizard feature was used. The same process was used to get the NOC regions into the Olympics database as a table.
- A couple of queries were written in SQL to extract the necessary data. SQL files contain commented out codes and tests which were used to verify the data results. (See SQL queries accordion below)
- The query result data was then copied from MySQL and pasted into Excel
- In Excel a variety of techniques were used in order to produce the final Excel sheet named Q2_Entrants_and_medals.xlsx which would be used in Tableau for further analysis.
- Data from noc_code_region_countrycode_country.txt file and HostCities_Countries_Years.csv file were added into separate sheets in the Excel file
- The SQL data located in “total athletes entrants medals” sheet was enhanced in the following ways:
- Vlookup to bring in country codes which correlated to the NOC code
- Countifs to determine if the country (based on country code) was a host country or not
- Vlookup to bring in the medal count based on the correlating NOC
Below find the SQL code which was used to obtain the answers. This code includes a few different pieces which would be commented out as needed. If you would like any of the data files, please let me know.
File: Q1_Olympics-year-country-season-total-medals.sql
-- Shows sum medals per season for each country per year
SELECT a.oly_year, a.season, a.noc, COUNT(a.medals) AS MedalCount
FROM athletes a
WHERE medals <> 'NULL'
GROUP BY oly_year, NOC, season
ORDER BY oly_year, NOC, season;
File: Q2_Olympics-year-country-season-total-athletes.sql
-- Shows number of athletes per noc TOTAL from 1960-2016.
-- Cross checked and validated data with example CAN in 1960 has 129 total WHERE oly_year = '1960'.  Received correct numbers.
SELECT noc,COUNT(DISTINCT athlete_id) AS athletes
FROM athletes
GROUP BY noc;

-- Same as above but without DISTINCT on athlete-id as we needed entrants not athletes.
SELECT noc,COUNT(athlete_id) AS athletes
FROM athletes
GROUP BY noc
ORDER BY noc;

-- Medal count per noc TOTAL from 1960-2016
-- Cross checked and validated data with example WHERE medals <> 'NULL' AND noc = 'CAN' AND oly_year = '1960'  = 30.  Received correct numbers.
SELECT a.noc, COUNT(a.medals) AS MedalCount
FROM athletes a
WHERE medals <> 'NULL'
GROUP BY noc
ORDER BY noc;

-- Testing what CAN had for number of athletes for 1960 summer
SELECT DISTINCT athlete_id, season, oly_year, noc
FROM athletes
WHERE oly_year = '1960' AND noc = 'CAN' AND season = 'Summer';

-- Testing number of athletes total for CAN
SELECT noc, COUNT(DISTINCT athlete_id)
FROM athletes
WHERE noc = 'CAN';
Question 2 Data Analysis and Visualization
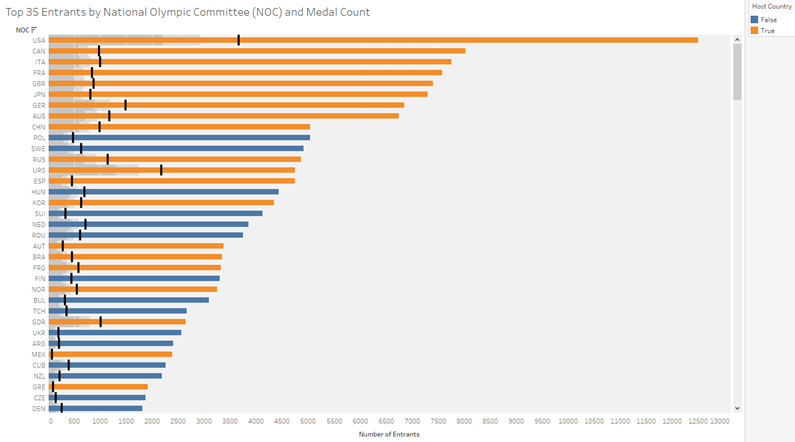
The bar chart above depicts
-
- In descending order, the NOC teams and the total number of entrants each had for the Olympic games, summer and winter, from 1960 to 2016
- Number of medals each NOC team won (the black tick on the bars)
- If at one point, they were a host country (orange) or not (blue)
The USA, Canada and Italy had the most entrants in Olympic sporting events. Respectively their ratio of entrants to one medal is, USA 3.4:1, Canada 8.2:1 and Italy 7.7:1.
Interestingly nearly all NOC teams whose country hosted one or more Olympic games appear in the top 35 NOC teams for number of entrants. It should be noted that one NOC team was not in the top 35. The EUN, known as the Unified Team, was representing the former Soviet Union in the summer and winter Olympics in 1992.
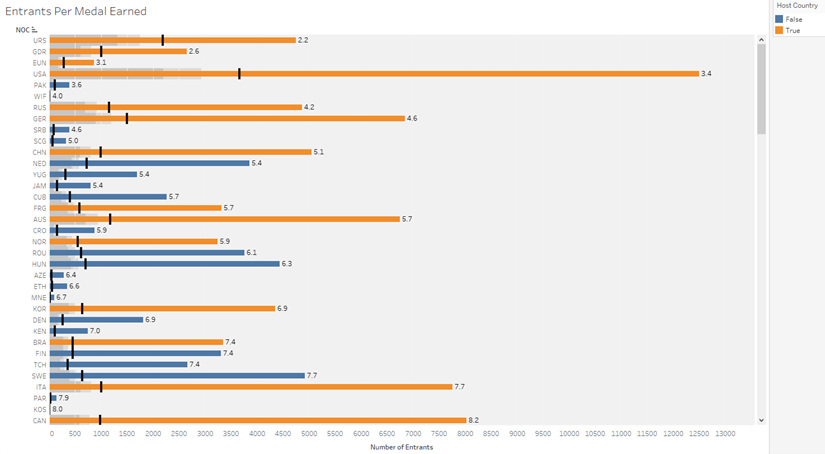
This second bar chart depicts
- In descending order, the NOC team and ratio of entrants to one medal (the number at the end of the bar)
- The total number of entrants each had for the Olympic games, summer and winter, from 1960 to 2016
- Number of medals each NOC team won (the black tick on the bars)
- If at one point, they were a host country (orange) or not (blue)
With the help of a calculated field in Tableau, we were able to determine ratio of entrants to medals and sort the data by this ratio.
The top three NOC teams were very successful in gaining the highest number of medals with less entrants in Olympic sporting events. These three NOC teams no longer exist. These teams were:
- URS – Soviet Union until 1991
- EUN – Unified team competing as former Soviet Union in 1992
- GDR – Eastern Germany under Soviet rule until October 1990
The sports regime under Soviet rule was known to be intensive, deliberate, and clearly effective.
Soviet rule over Russian and East Germany ceased over 24 to 26 years ago and yet they still hold the highest medal success statistics today as seen by the bar chart. URS saw 2.2 entrants per medal, GDR 2.6 entrants, and the EUN 3.1.
Question 4 Data Queries
Question: How many athletes participate in both summer and winter games and are there any trends around the sports that they participate in? Are there any stand-outs?
Dual sport athletes were also a topic which interested us. We were interested in finding out how many athletes completed in both summer and winter Olympic games throughout their career. As well we wanted to determine what combination of summer and winter sports were most popular and why.
In order to answer this question, we needed to determine the following:
- the total number of athletes who participate in both summer and winter Olympics
- the summer and winter sport each dual sport athlete competed in
- if dual sport athletes win medals in both sports
This answer and analysis were done using MySQL Workbench, Excel and Tableau.
- As per question 2, the data was cleaned and imported/loaded into the Olympics database in MySQL Workbench.
- A more complex SQL query was written using a WITH clause to extract the necessary data. (SeeS SQL queries accordion below)
- The query result data was then copied from MySQL and pasted into Excel
- In Excel a variety of techniques were used in order to produce the final Excel sheet named Q4_Dual_Sport_Athletes.xlsx which would be used in Tableau for further analysis.
- The SQL data located in “Dual Sport Athletes” sheet was enhanced in the following ways:
- Filtering sport column to review results and clean up any duplicates. Some sports were listed summer then winter, and others were winter then summer.
- UNIQUE function to extract a list the unique sport combinations
- Countif to determine the number of times the sports combination appeared in the data array
- Text to columns to take original concatenated data of “sport,sport” and split into two columns and bring back together as “sport – sport” which worked better when used in Tableau
- The SQL data located in “Dual Sport Athletes” sheet was enhanced in the following ways:
Below find the SQL code which was used to obtain the answers. This code includes a few different pieces which would be commented out as needed. If you would like any of the data files, please let me know.
File: Q4_Dual_Sport_Athletes.sql
-- To get the count of athletes who were Summer AND Winter
SELECT DISTINCT a.athlete_id, a.athlete_name
FROM athletes a
WHERE athlete_id IN
	(SELECT athlete_id FROM athletes WHERE season = 'Summer')
		AND athlete_id IN
			(SELECT athlete_id FROM athletes WHERE season = 'Winter')
ORDER BY a.athlete_id, a.athlete_name ASC;

--To get instances of when athlete was SUMMER AND WINTER
SELECT athlete_id, athlete_name, sport, oly_events
FROM athletes a
WHERE athlete_id IN
 	(SELECT athlete_id FROM athletes WHERE season = 'Summer')
 		AND athlete_id IN
 			(SELECT athlete_id FROM athletes WHERE season = 'Winter')
ORDER BY athlete_id;

--  SELECT per athlete what sport did they do in summer and winter (mostly pairs)
SELECT DISTINCT sport, athlete_id, athlete_name
FROM athletes a
WHERE athlete_id IN
	(SELECT athlete_id FROM athletes WHERE season = 'Summer')
		AND athlete_id IN
			(SELECT athlete_id FROM athletes WHERE season = 'Winter')
ORDER BY athlete_id;

-- Table with id, name and sports concatted for xls analysis
WITH discsports AS (
SELECT DISTINCT sport, athlete_id, athlete_name, athlete_country_code
FROM athletes a
WHERE athlete_id IN
 	(SELECT athlete_id FROM athletes WHERE season = 'Summer')
 		AND athlete_id IN
 			(SELECT athlete_id FROM athletes WHERE season = 'Winter')
ORDER BY athlete_id)
SELECT
	athlete_id,
 	athlete_name,
              athlete_country_code,
             GROUP_CONCAT(sport) AS 'all_sports'
FROM discsports
GROUP BY athlete_id;
Question 4 Data Analysis and Visualization
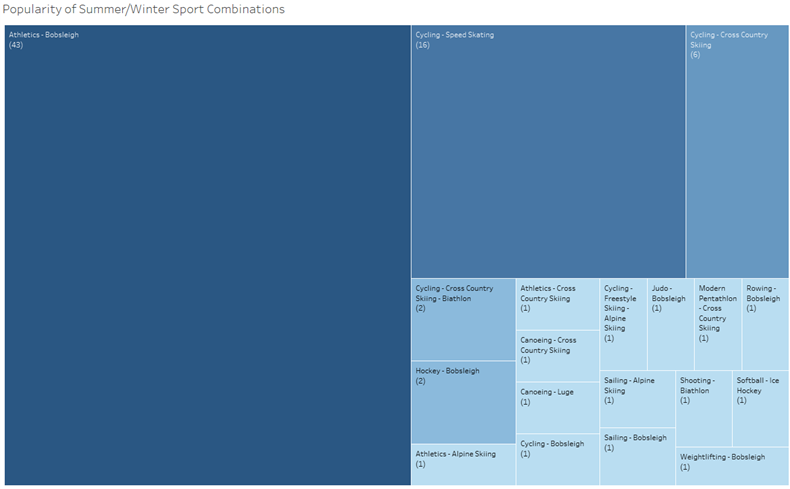
As seen in the treemap chart above, of the 507 athletes who competed in the Olympics since 1960 to 2016, there were 83 athletes who competed both in the summer and winter games.
The top three sport combinations include:
- Athletics / Bobsleigh (43 athletes)
- Cycling / Speed skating (16 athletes)
- Cycling / Cross country skiing (6 athletes)
The athletes that competed under the Athletics sport category were typically runners.
With such popularity for athletes who compete in Athletics / Bobsleigh and Cycling / Speed skating the question was why?
Athletics / Bobsleigh
Nearing the late 1950s, as the sport was developing into what it is today it looks like it was not uncommon to recruit athletes from athletics (track and field) to bobsleigh. Athletes who compete in Athletics, particularly runners, seem more likely to convert over to bobsleigh. This duality is attractive to athletes as it elongates their athletic career.
(source: https://news.medill.northwestern.edu/chicago/changing-lanes-track-athletes-switch-to-bobsled-to-prolong-athletic-careers/ and https://www.ibsf.org/en/our-sports/bobsleigh-history)
Cycling / Speed skating
The commonalities between cycling and speed skating are well documented. Among the reasons for athletes to compete in both sports includes:
- Physiology
The body position of a cyclist and speed skater are very similar in that both are hunched over for increased aerodynamics. Their legs are their source of power however the rest of their body needs to be conditioned to sustain the hunched position for short to long periods of time depending on the sporting event being competed in. - Drafting techniques
The way athletes can benefit from the athletes competing against them is similar in that they can position themselves strategically which uses less energy in the hopes that the energy can be used closer to the finish line. - Suffering
In both sports it is the athlete that can endure the most in the fastest time who wins. In addition to the physical boundaries that are pushed these athletes need to be mentally tough.
(source: http://www.bikeroar.com/articles/speed-skating-and-cycling-the-similarities-are-uncanny)
Interestingly, very few athletes medal in both seasons. If they do medal, they will be stronger in one sport than the other. This was analyzed in Alyson’s Olympic Analysis_Queries Removed.xlsx file, under the Dual Athlete Medals tab.
Athletes who have medaled in both a summer and winter Olympics include:
- Clara Hughes, Canada, Cycling / Speed Skating
- Christa Rothenburg, Germany, Cycling / Speed Skating
- Lauryn Chenet Williams – USA, Athletics (100m) / Bobsleigh
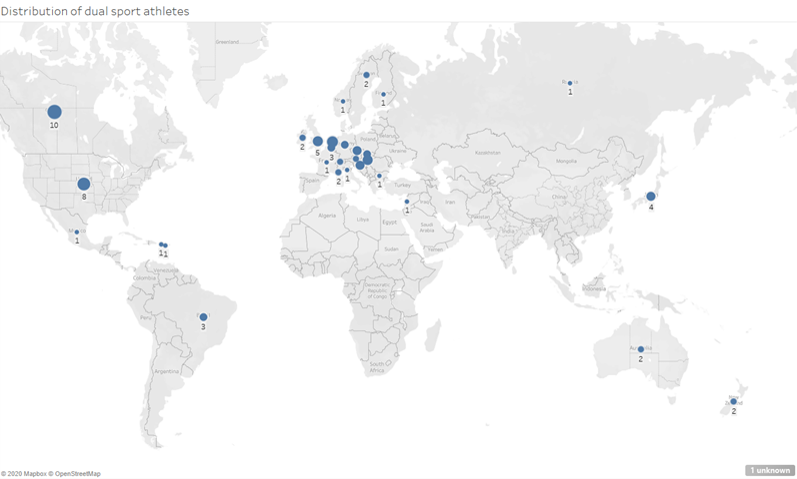
The map depicts where in the globe dual sport athletes are located. From 1960 to 2016, Canada had the most athletes who completed in both the summer and winter games. USA had 8, and the Netherlands with 6.
In the map there is 1 unknown. This is not a mistake. This is a record of Aleksandar Milenkovi who completed in Cycling, Cross Country Skiing and Biathlon. He competed as an IOA (Individual Olympic Athlete) as Yugoslavia dissolved and Serbia came to be. He competed as YUG, IOA and SRB in his years in the Olympics.
IOAs are athletes who compete as Independent Olympians for various reasons, including political transition, international sanctions, suspensions of National Olympic Committees, and compassion.
(source: https://en.wikipedia.org/wiki/Independent_Olympians_at_the_Olympic_Games)
Conclusion
Conclusion regarding questions 2 and 4:
While it doesn’t always hold true, our analysis did support our hypothesis that a country’s success at the Olympics is highly correlated to the number of entrants that they bring to the Olympics. The USA in particular has the largest cumulative number of entrants over time and by far the largest number of medals won. However the countries under old soviet rule somewhat go against this theory in that they have the highest number of medals won to entrants (e.g. the Soviet Union required only 2.2 entrants for every medal won). So while there are definitely exceptions, the correlation of medals won to entrants is quite high (0.84 on a per country/per games analysis).
Lastly, the Olympics have had a number of athletes who participate in both the summer and winter Olympics. The most common sport combination are athletes who participate in Athletics (particularly running) in the summer and changed over to Bobsleigh for the winter. The next popular combination is cycling and speed skating. Dual sport athletes are not highly likely to medal in both sports and there seems to always be one sport which is their strength. Dual sport athletes therefore do not have a significant impact on a country’s improved success in either Olympic games.
Credits
Software
- Microsoft Excel
- MySQL Workbench 8.0 CE
- Tableau 2020.3
Images
- Portfolio cover image
Photo by Bryan Turner on Unsplash